Prometheus and Azure Monitor - Scalable Monitoring Solutions

In today’s fast-changing world of computer systems, making sure system work well and don’t break down is really important. That’s where Prometheus comes in. It’s a free toolkit that helps keep an eye on things and warns engineers when something might be going wrong in the collection of information that computer systems create.
What is Prometheus?
You might have seen the movie Prometheus! but I am here to talk about open source monitoring system Prometheus, which comes in when there was a need for a robust monitoring solution for cloud-native environments, It is an open-source project set by the Cloud Native Computing Foundation (CNCF). Launched in 2012 by SoundCloud, it swiftly gained traction within the tech community due to its flexibility, scalability, and powerful querying language, PromQL.
Website: https://prometheus.io/
“treating time-series data as a data source for generating alerts is now accessible to everyone through open source tools like Prometheus - O’Reilly Media”
How Does Prometheus Work?
At its core, Prometheus follows a pull-based model, periodically scraping metrics data from configured targets such as applications, services, and infrastructure components. These targets expose metrics in a simple text-based format, typically over HTTP. Prometheus stores these metrics in a time-series database, facilitating flexible querying and analysis.
Key Features
-
Multi-dimensional Data Model: Prometheus embraces a multi-dimensional data model, allowing users to slice and dice metrics data using various dimensions such as labels. This enables precise monitoring and targeted alerting.
-
Flexible Querying with PromQL: PromQL, Prometheus’s powerful query language, empowers users to perform complex analytics, aggregations, and transformations on metrics data. This flexibility facilitates real-time insights into system behavior.
-
Scalability: Prometheus’s decentralized architecture enables horizontal scalability, making it suitable for environments ranging from small startups to large enterprises. Additionally, Prometheus seamlessly integrates with other CNCF (Cloud Native Computing Foundation) projects like Kubernetes for orchestrated scaling.
-
Alerting and Notification: Prometheus’s alerting capabilities are second to none. With configurable alerting rules and integrations with popular notification platforms like Slack and PagerDuty, teams can stay informed about critical issues in real-time.
Use Cases
- Infrastructure Monitoring: Prometheus excels in monitoring the health and performance of infrastructure components such as servers, containers, and network devices.
- Application Monitoring: With support for various programming languages and frameworks, Prometheus enables comprehensive monitoring of applications, providing insights into resource utilization, latency, and error rates.
- DevOps and Site Reliability Engineering (SRE): Prometheus plays a pivotal role in DevOps and SRE practices, facilitating observability, incident response, and post-mortem analysis.
How to Integrate with Azure Monitor
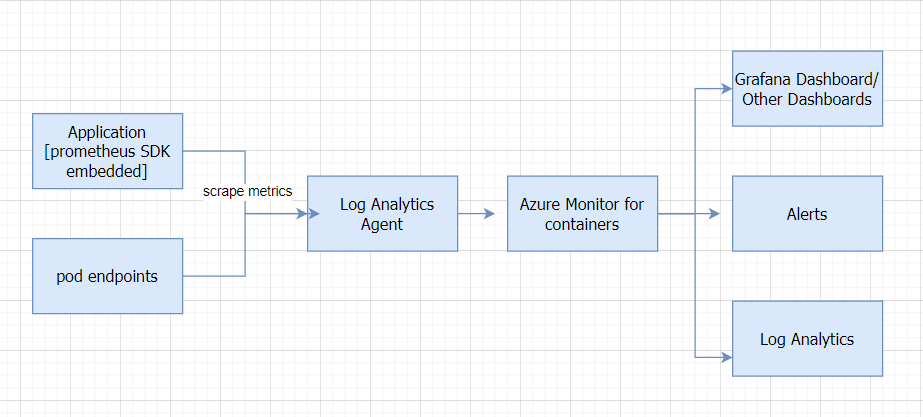
We can get all the metrics from Prometheus without Prometheus management system using Azure Monitor and create dashboard without any management overhead.
More and more people using open source software and best of it, and combine it with best of Cloud providers like Azure. In addition, We usually don’t want to monitor the monitoring tools!
Azure/Monitor for containers Metrics - https://grafana.com/grafana/dashboards/10956-azure-monitor-for-containers-metrics/
Conclusion:
In today’s world, there are lots of small services, containers, and computer setups that work in the cloud. Prometheus is like a big light guiding us through all these systems. It’s reliable and lets us keep a close watch on things. Because it’s strong, can handle big loads, and has lots of helpful tools, many companies use it to build strong, fast systems. As technology keeps changing, Prometheus keeps up, helping engineers deal with the tricky parts of modern computer setups.
Prometheus is 100% open source and community-driven. All components are available under the Apache 2 License http://www.apache.org/licenses/LICENSE-2.0 on GitHub https://github.com/prometheus/prometheus"

